Cycle Counting: The Complete 2026 Guide
Cycle counting is an inventory auditing method where you count a rotating subset of your stock on a regular schedule instead of shutting down for a full physical count. A well-run cycle count program keeps inventory accuracy above 97% year-round while operations continue without interruption. This guide covers every method, how to build a schedule from scratch, and the mistakes that quietly destroy accuracy.
Cycle counting is an inventory auditing method where you count a rotating subset of your stock on a regular schedule instead of halting all warehouse activity for a full physical count. Done correctly, it keeps inventory accuracy above 97% year-round while your operation runs without interruption.
Cycle counting is the professional standard for continuous inventory verification: rather than a single annual snapshot that is outdated the moment the doors reopen, your team counts a small slice of inventory every day or week and catches errors before they become expensive.
According to CAPS Research, the average inventory accuracy rate across businesses in 2024 was just 83%, with roughly 69% of companies even tracking the metric. Operations that rely on annual physical counts alone typically drift to 75 to 80% accuracy between count events. A disciplined cycle count program changes that entirely.
This guide covers every counting method, how to build a schedule from scratch, what the common mistakes are, and how to get from wherever you are now to the 97% target that most serious warehouse operations use as their floor.
What Does Cycle Counting Actually Mean?
A cycle count is not a special event. It is a routine task, the same as checking pick errors or replenishing locations, performed on a fixed cadence.
Here is how it works in practice:
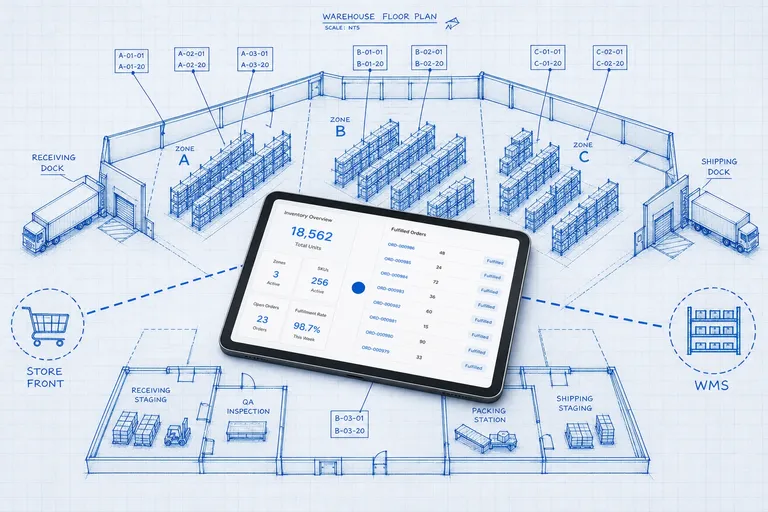
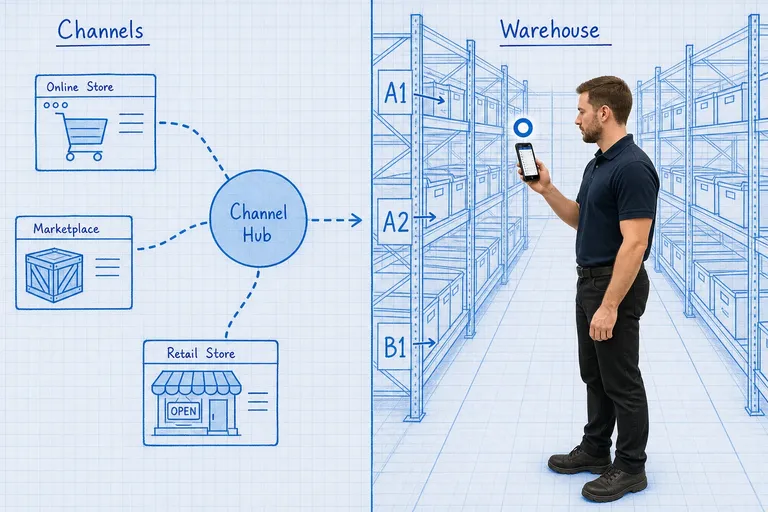
- Your warehouse management system (WMS) or inventory platform generates a count list for today's locations or SKUs.
- A team member counts those items without looking at what the system expects (this is called a blind count, and the distinction matters).
- The actual quantity is recorded and compared against the system quantity.
- Any discrepancy is investigated, the root cause is documented, and the record is corrected.
- The cycle repeats the next day with a different subset.
Over time, every location in your warehouse gets counted multiple times per year. High-value locations get counted more often. By the time a problem shows up, it is days old rather than months old. That is the core advantage.
Why Cycle Counting Beats the Annual Physical Count
The traditional wall-to-wall physical inventory count requires you to freeze all stock movement, often for 1 to 3 full days. No receiving. No shipping. No picking. Everything stops while your team counts everything at once.
The result is a single snapshot that is accurate only on the day of the count. The moment operations resume, errors start accumulating again and stay hidden until the next shutdown.
Cycle counting flips this model. Because you count small batches continuously, errors surface within days. A receiving mistake made on Monday is typically caught by Wednesday's count of that location. The same mistake in an annual physical count sits undetected for up to 12 months.
The cost difference is substantial. According to analysis by CPCON Group, organizations managing 50,000 or more SKUs typically spend $120,000 to $200,000 on a single annual physical count event. A cycle count program serving the same warehouse runs $60,000 to $100,000 per year while delivering 40 to 60 percent lower total verification costs, higher sustained accuracy, and no shutdowns.
For a detailed head-to-head cost and accuracy breakdown between these two approaches, see Cycle Count vs Physical Inventory: Which Is Better?.
The Four Main Cycle Counting Methods
No single method fits every operation. The right choice depends on how many SKUs you manage, where errors tend to cluster, and how much counting capacity your team has.
ABC Cycle Counting
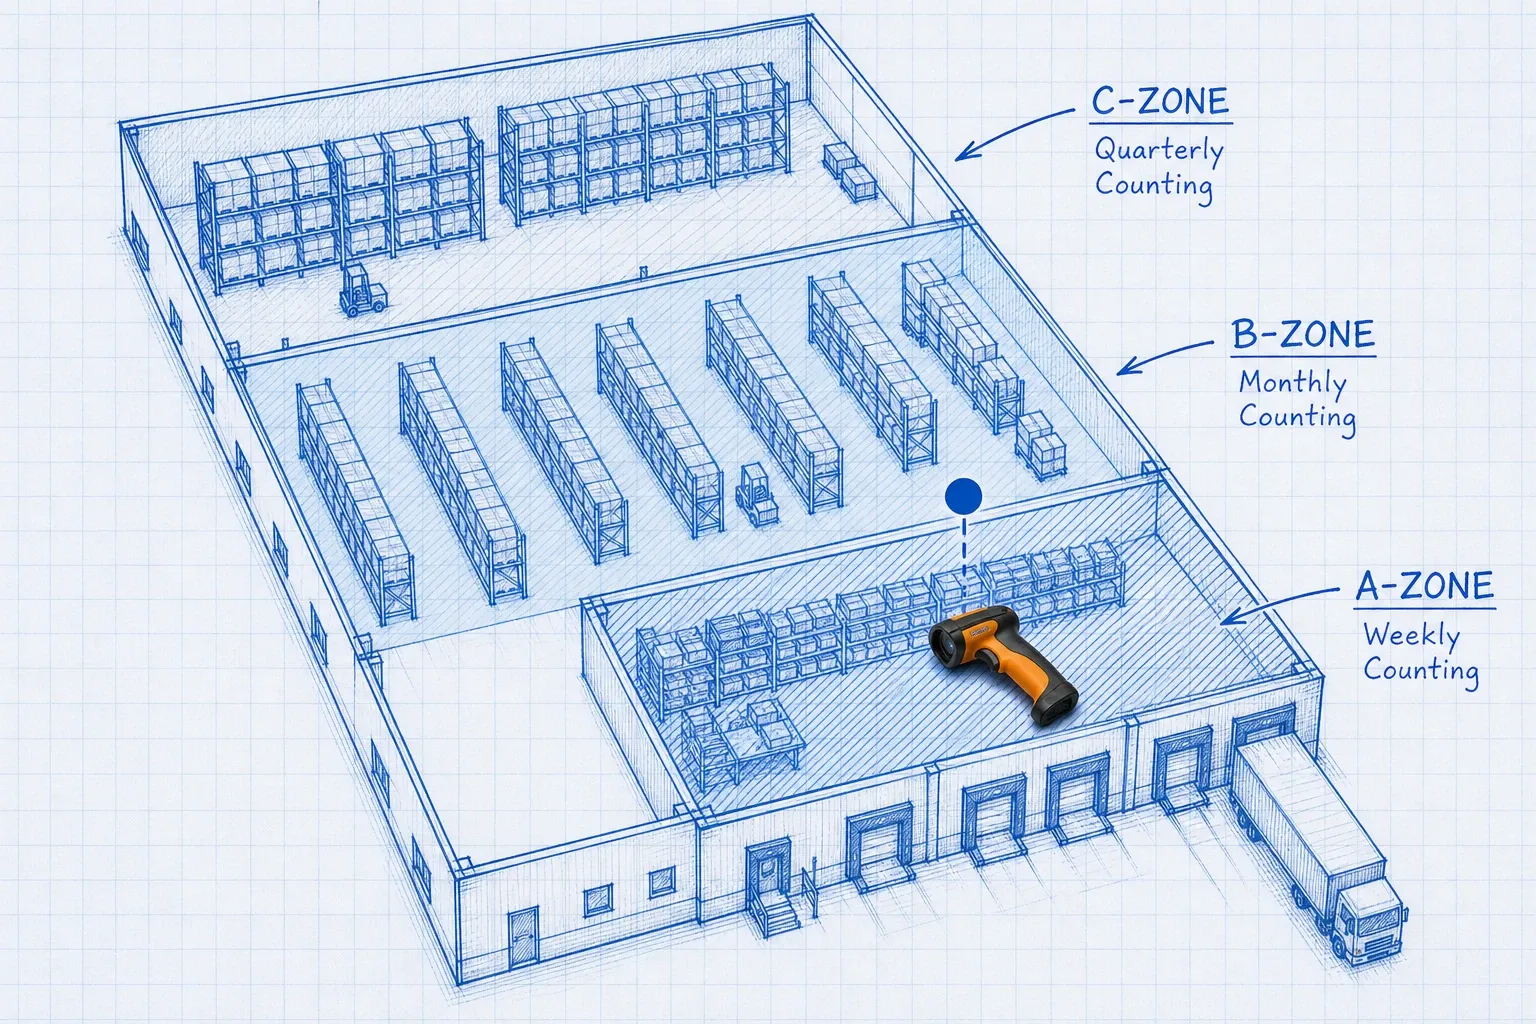
ABC analysis is the foundation of most professional cycle count programs. It classifies every SKU into three tiers based on value and velocity, then assigns a count frequency to each tier.
Tier | What it represents | Count frequency |
|---|---|---|
A | Top 20% of SKUs by value (roughly 80% of total inventory value) | Weekly |
B | Mid-tier by value or movement | Monthly |
C | Low-value, slow-moving items | Quarterly |
The logic is straightforward. An error on a $500 component costs far more than an error on a $2 fastener. Weekly counts on A-items keep your highest-risk stock clean. Quarterly is enough for items where the financial exposure of a discrepancy is low.
If you are starting from scratch, start with ABC. It produces the best risk-adjusted accuracy per hour of counting effort.
Random Sample Cycle Counting
Instead of fixed tiers, you select SKUs or locations statistically. Each batch is generated randomly across the full warehouse, giving every location an equal probability of being selected in a given period.
Random sampling works well for large facilities that want broad coverage without the setup overhead of tier classification. It is less targeted than ABC but provides consistent statistical coverage when applied regularly.
Control Group Cycle Counting
A control group is a small, fixed set of locations counted repeatedly to validate your counting process before you scale it. You count the same 20 to 50 locations daily for several weeks, compare results, and use the variance data to test whether your process itself is reliable.
This is the right starting point when you suspect your counting technique or your team's consistency may be off. Fix the process first, then expand.
Opportunity-Based Cycle Counting
In opportunity-based counting, staff count a location whenever they are already nearby for another task: a replenishment put-away, a directed pick, or a zone sweep. No separate counting window is scheduled.
The advantage is zero incremental labor. The disadvantage is irregular coverage: popular locations get counted often while quiet zones can go months without a check. Use opportunity counting as a supplement to ABC, not a replacement for it.
How to Build a Cycle Count Schedule from Scratch
ABC counting is the right starting point for most mid-size warehouses. Here is how to set it up.
Step 1: Pull Your SKU List and Assign ABC Tiers
Export your full SKU list with annual sales value and unit velocity. Sort by total annual value, descending. Assign:
- A to the top 20% of SKUs (the group representing roughly 80% of your total inventory value)
- B to the next 30%
- C to the remaining 50%
If your WMS does not have a built-in ABC classification tool, a spreadsheet sort by annual value is sufficient to get started.
Step 2: Calculate Your Daily Count Target
Take your total SKU count and work out how many items you need to count per day to complete one full cycle within your target window.
Example: 5,000 SKUs, target of one full quarterly cycle for C-items and weekly coverage for A-items.
- A-items (1,000 SKUs, counted weekly): 1,000 / 5 working days = 200 A-items per day
- B-items (1,500 SKUs, counted monthly): 1,500 / 21 working days = 72 B-items per day
- C-items (2,500 SKUs, counted quarterly): 2,500 / 65 working days = 39 C-items per day
Total daily count: roughly 311 items. For a trained team with scanners, that is 60 to 90 minutes of focused work.
Step 3: Schedule Counts During Low-Traffic Windows
Count when the area is quiet. Early morning, before order picking begins, is the most common window. Avoid counting a location that is actively being picked or replenished because in-flight transactions create false discrepancies.
Most modern WMS platforms, including BinLogic, let you automatically exclude locations with open transactions from the count schedule.
Step 4: Enforce Blind Counting
The most important procedural rule is the blind count. Counters should not see the system quantity before they count. This is not optional if you want reliable data.
When counters see the system quantity first, they tend to stop at that number. Cognitive confirmation bias is powerful. A blind count forces an honest tally and exposes the gaps that motivated counting misses. If you implement only one change this week, make it this one.
For more on how cycle counting works at the task level, that post covers the mechanics and variance investigation process in detail.
Step 5: Investigate Variances Rather Than Just Correcting Them
A discrepancy is not just a number to fix. It is a signal.
When the count does not match the system, trace it:
- Was there a receiving error? Check the inbound receipt for that location.
- Was it a picking error? Review recent pick transactions for the location.
- Was it a put-away mistake? The product may be in the wrong bin.
- Is there theft or damage? Look at variance frequency for patterns.
Adjusting the number without answering the question fixes today's count and guarantees the same error next month. The teams that sustain 97% accuracy over years are the ones that document and address root causes, not just reconcile numbers.
Step 6: Track Your Accuracy KPIs Weekly
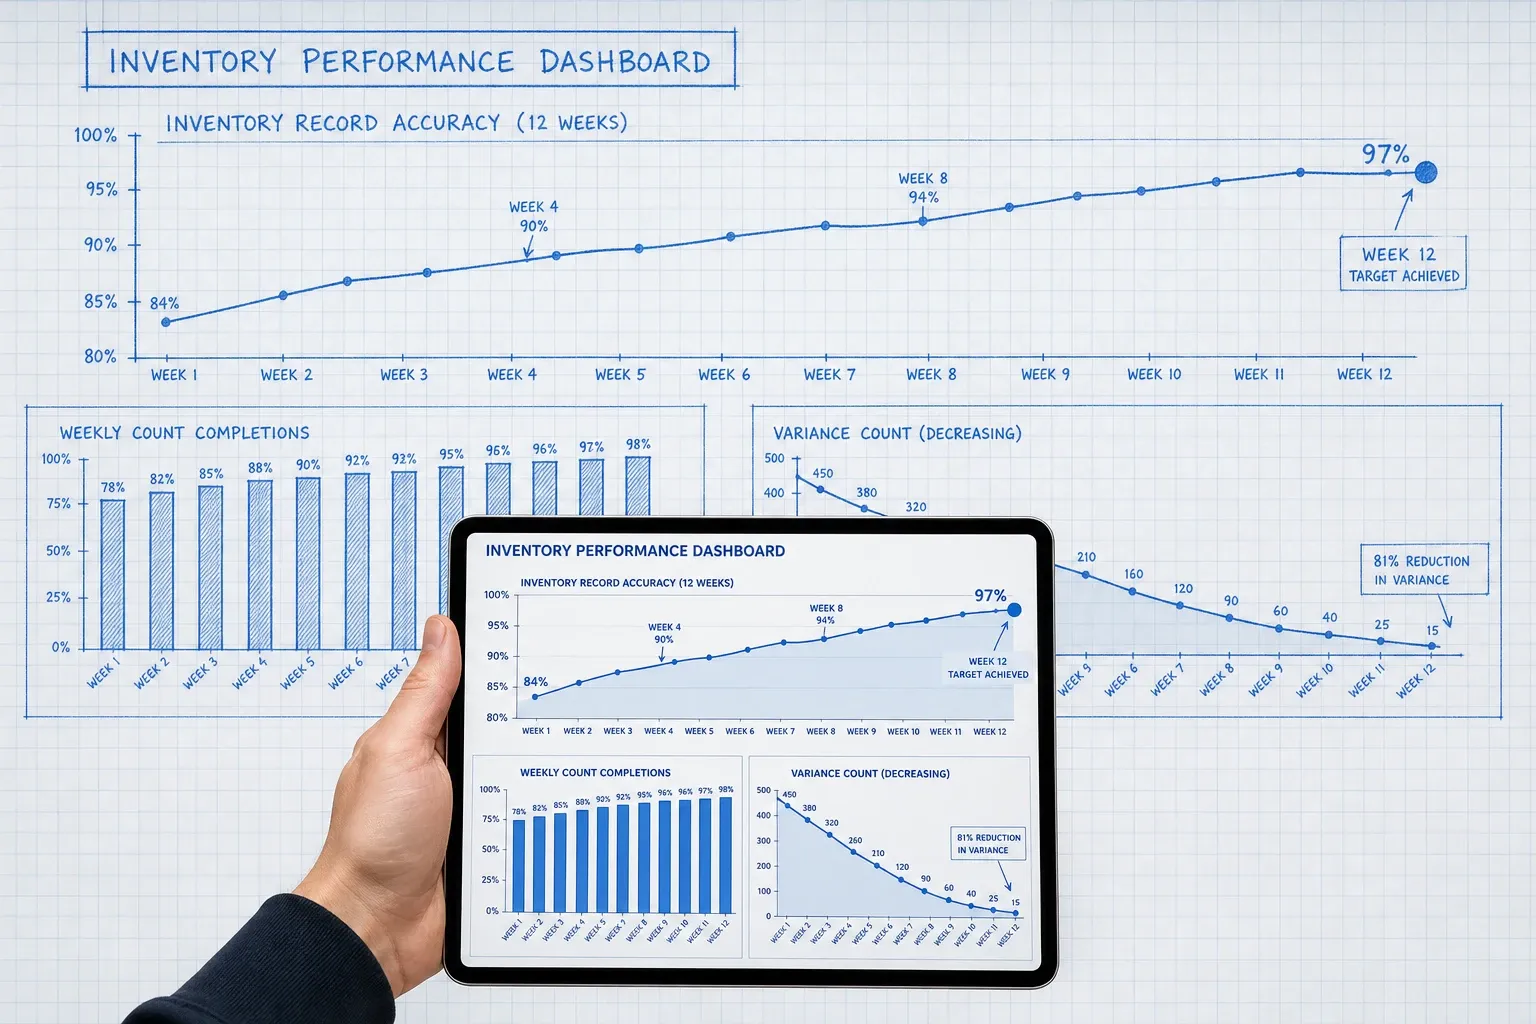
The core metric is Inventory Record Accuracy (IRA):
IRA = (Locations counted correctly / Total locations counted) x 100
The industry target is 97%. Measure it weekly. Expect gradual improvement over 3 to 6 months as your team builds the routine and root causes get corrected.
Additional metrics worth tracking:
- Percentage of counts requiring an adjustment
- Average dollar value of adjustments per week
- Variance trend by zone or team
Common Mistakes That Quietly Undermine Cycle Count Programs
A cycle count program that fails usually fails for one of these reasons.
Counting A-items too infrequently. Monthly counts on high-value stock mean errors sit for up to four weeks. Weekly is the floor for anything in your A tier.
Skipping blind counts. If counters see the system quantity first, your data is unreliable. This single mistake invalidates the accuracy improvement you are trying to measure.
No root cause analysis. Adjusting discrepancies without investigating why produces accurate numbers today and identical errors next month.
Counting during active operations. An in-progress pick or put-away in a location creates a phantom discrepancy. Configure your WMS to exclude locations with open transactions from count batches.
Inconsistent cadence. Three counts one week and none the next produces sporadic data. Fifty SKUs counted every single day beats five hundred SKUs counted once a month. Consistency is the variable that matters most.
How a WMS Makes Cycle Counting Sustainable at Scale
Running a manual cycle count program from a spreadsheet is feasible for small warehouses under 500 SKUs. It is not sustainable at scale. Beyond that threshold, you need a system that generates count schedules automatically based on ABC tiers, enforces blind counts by hiding expected quantities from counters, records variances digitally at the point of count, and routes unresolved discrepancies to an operations queue.
BinLogic WMS handles count scheduling, daily list generation on mobile devices, and variance routing without requiring a separate spreadsheet layer. Counters see only the location and the item. The expected quantity stays hidden until after the count is submitted, so blind counting happens by default rather than by policy enforcement.
That default matters. Every manual policy that relies on a person choosing to do the right thing erodes over time. The right WMS removes the choice entirely.
For a broader look at what inventory accuracy is and how it is calculated, that post covers the formulas, benchmarks, and what good looks like for different operation types.
Getting Started This Week
You do not need a perfect program on day one. You need a working program you can improve.
Start here:
- Export your SKU list and assign ABC tiers this week.
- Count your A-items only for the first two weeks.
- Enforce blind counts from day one.
- Investigate every variance, no matter how small.
- Measure IRA weekly and share it with your team.
Most warehouses that follow this sequence see measurable accuracy improvement within 30 days. The goal is not perfection on day one. The goal is a counting cadence your team actually sustains.
If you want to see what cycle counting looks like inside a WMS built for mid-market warehouse operations, take a look at how BinLogic handles it.
Frequently asked questions
What is cycle counting in inventory management?
Cycle counting is an inventory auditing method where you count a rotating subset of your stock on a regular schedule instead of shutting down to count everything at once. A well-run program audits each location multiple times per year while operations continue without interruption.
How often should you do cycle counts?
The standard cadence follows ABC classification: A-items (the top 20% by value) should be counted weekly, B-items monthly, and C-items quarterly. High-risk or regulated locations may need daily verification. Frequency should reflect how costly a discrepancy would be if it went undetected for several months.
What is the difference between cycle counting and a full physical inventory count?
A full physical count stops all warehouse activity for 1 to 3 days to count everything at once. Cycle counting spreads the work across short daily or weekly windows with no operational shutdown. Cycle counting typically produces better long-term accuracy because errors are caught in days, not months.
What is ABC analysis in cycle counting?
ABC analysis ranks every SKU by value or velocity: A-items represent roughly 20% of SKUs but 80% of inventory value, B-items are mid-tier, and C-items are low-value slow-movers. The ABC tier determines how often each item gets counted in your cycle count schedule.
What is a blind count and why does it matter?
In a blind count, the counter records the quantity they find without first seeing what the system expects. This removes the temptation to round up to match and produces honest variance data. Blind counts are the single most effective way to catch systematic errors that reconciled counts would miss.
Plan the route. We deliver the rest.
See how Binlogic powers last-mile logistics — routing, tracking, and the platform that turns the plan into the package on the doorstep.
Book a callback