
















How to Calculate WMS ROI (and Make the Case Internally)
WMS ROI is (annual benefits minus annual costs) divided by total investment, times 100. Most organizations see payback within 12 to 24 months when they count labor, inventory, and error savings against full project cost. Use your own warehouse numbers, not vendor averages, and present payback period alongside ROI so finance can approve with confidence.
WMS ROI is the annual net benefit of a warehouse management system divided by what you invest to get it live. Put simply: WMS ROI equals (annual benefits minus annual ongoing costs) divided by total implementation investment, then multiplied by 100. Most mid-market warehouses that model labor, inventory accuracy, and error reduction honestly land in a 12 to 24 month payback window.
This guide walks you through the formula, the inputs that actually move the number, a worked example you can adapt, and how to present the case so finance does not send you back for "better data."
What does a WMS ROI calculator actually measure?
A WMS ROI calculator is not a vendor marketing toy. It is a structured estimate of cash you save (and sometimes revenue you protect) versus cash you spend to buy, implement, and run the system.
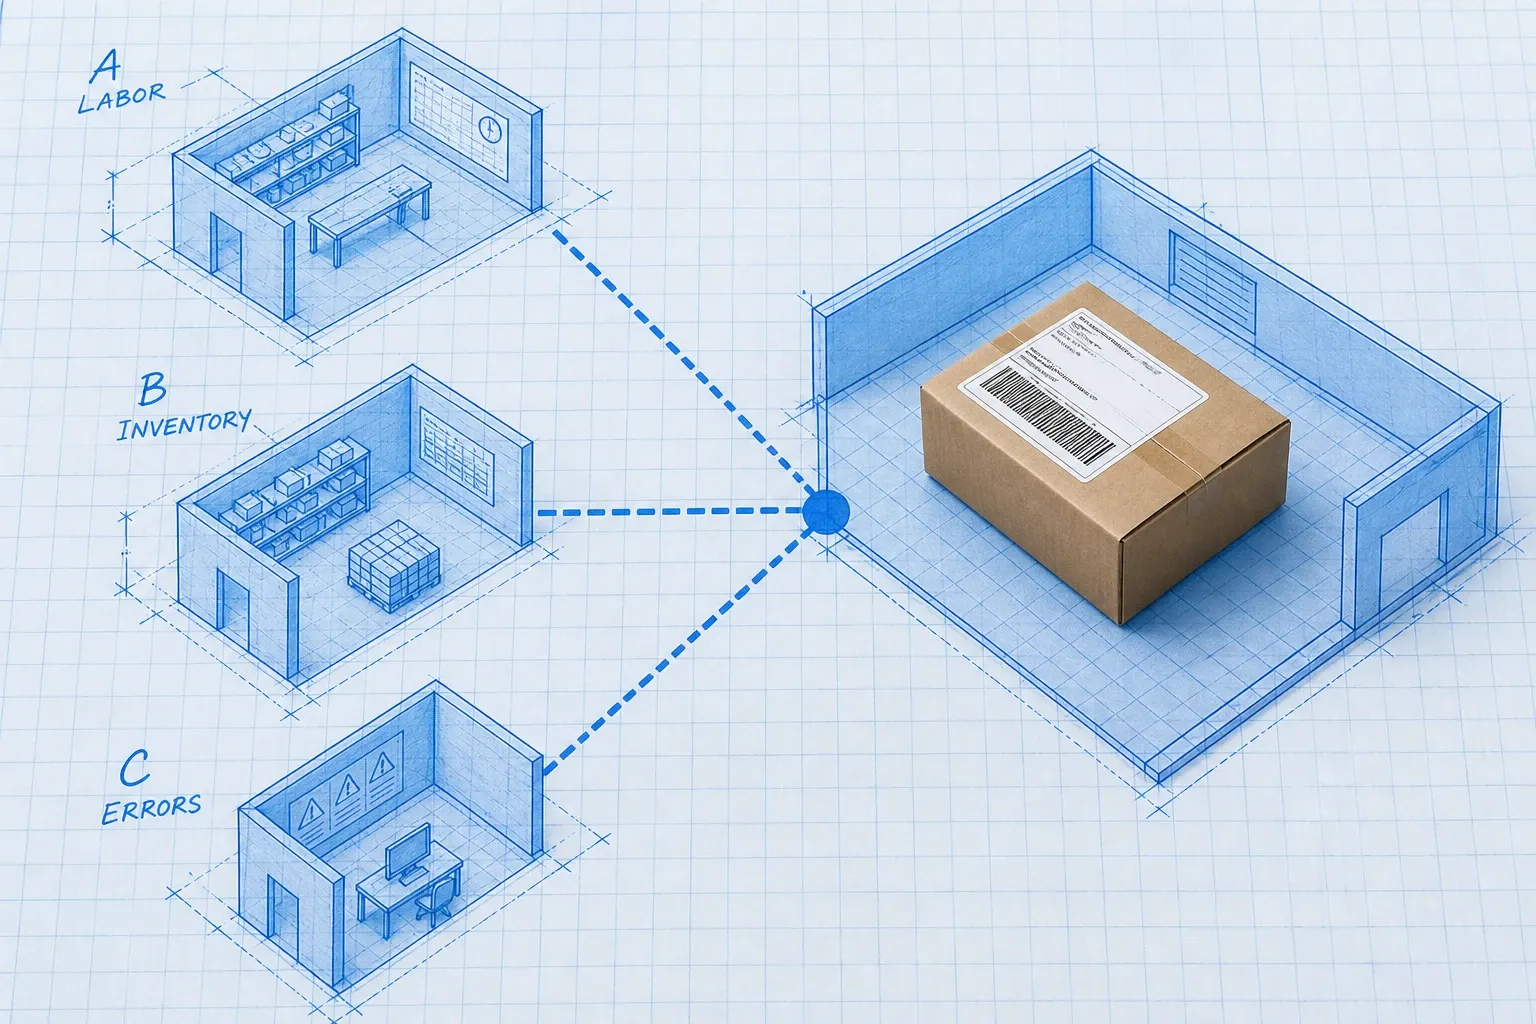
At minimum your model needs three buckets:
- Total investment (one-time and year-one ramp costs)
- Annual benefits (labor, inventory, errors, space, and avoided waste)
- Annual run cost (subscription, support, and device refresh)
If any bucket is missing, your ROI is fiction. Finance will spot it.
You can run a simple version in a spreadsheet in an afternoon. Tools like BinLogic WMS make the benefit side easier later because barcode-directed work and real-time location data give you cleaner before/after metrics. The calculator itself still starts with your baseline numbers.
What is the WMS ROI formula?
Use this as your default:
ROI (%) = ((Annual Benefits − Annual Run Cost) ÷ Total Implementation Investment) × 100
Pair it with payback:
Payback (months) = Total Implementation Investment ÷ Monthly Net Benefit
Where Monthly Net Benefit = (Annual Benefits − Annual Run Cost) ÷ 12.
Why both? ROI alone can look huge on a cheap cloud subscription and still leave leadership unsure when cash breaks even. Payback answers the calendar question executives ask first.
Example (illustrative mid-market warehouse)
Assume:
- Total implementation investment: $80,000 (software year one, implementation, scanners, training)
- Annual benefits: $95,000
- Annual run cost after year one: $24,000
Net annual benefit = $95,000 − $24,000 = $71,000
ROI = ($71,000 ÷ $80,000) × 100 = 88.8%
Payback = $80,000 ÷ ($71,000 ÷ 12) ≈ 13.5 months
That is a credible story. It is not a guarantee. It is a model your CFO can challenge line by line.
Which costs belong in the investment side?
Understating cost is how ROI models die in review. Include every line finance will later see on an invoice or PO.
Software and services
- License or first-year subscription
- Implementation and configuration
- Integrations (ERP, ecommerce, shipping carriers)
- Data migration and testing support
- Training and change management
If you are still comparing quotes, our WMS cost breakdown for 2026 maps typical mid-market ranges so your denominator is not a guess.
Hardware and floor readiness
- Handheld scanners or rugged phones
- Label printers and Wi-Fi gaps that block scanning
- Temporary parallel-run labor during go-live
Ongoing costs (annual run cost)
- Subscription or maintenance
- Support tier
- Device replacement cycle
- Minor enhancement hours
Do not bury integration work inside "vendor will handle it." If your Shopify, Amazon, or ERP sync is custom, price it. Our 12-week WMS implementation playbook is a useful checklist for what usually shows up mid-project.
Which benefits should you quantify first?
Start with hard savings your warehouse already feels in the numbers. Soft benefits come later as supporting slides.
1. Labor productivity
Directed picking, better put-away, and fewer "where is it?" walks typically free 10% to 25% of floor time in mid-market sites. Industry ROI frameworks commonly use a 15% to 25% labor productivity range as a planning band. Stay conservative if your baseline is already disciplined.
Simple labor formula:
Annual labor savings = Headcount × Fully loaded hourly cost × Hours per year × Productivity gain %
Or:
Annual labor savings = Annual orders × Minutes saved per order × Labor cost per minute
Use overtime and peak temp spend as a second check. If your peak season burns overtime every year, model the overtime reduction separately. That line alone often pays for a meaningful chunk of a mid-market project.
2. Inventory accuracy and carrying cost
Nucleus Research found that organizations using a WMS improve inventory accuracy by an average of 20 percent, and that 46 percent of organizations see accuracy gains within the first year of deployment. Higher accuracy shrinks safety stock, stockouts, and write-offs.
Inventory savings formula:
Inventory reduction value × Carrying cost % (often 20% to 30% of inventory value in many industries)
Plus:
Avoided stockout revenue (conservative) and reduced write-offs from dead or misplaced stock
If you need a gut check on how expensive bad counts already are, read the real cost of inventory inaccuracy. That post is useful evidence when someone claims "our spreadsheet is fine."
3. Error, return, and rework cost
Mispicks, wrong-item shipments, and inventory adjustments create remakes, chargebacks, and refunds. Many deployments report large cuts in picking errors after scanning and system-directed work. Use your own cost per error:
Annual error savings = Annual orders × Error-rate reduction × Average cost to resolve one error
Average cost should include labor to investigate, reship shipping, return processing, and customer service time. If you only count postage, you will understate the win.
4. Space and throughput (optional but strong)
Better slotting and location control can free 10% to 20% of usable space in some sites, delaying an expansion or second lease. Throughput gains also protect revenue when you hit cutoffs more consistently. Count space savings only when you have a real alternative use or deferred CapEx.
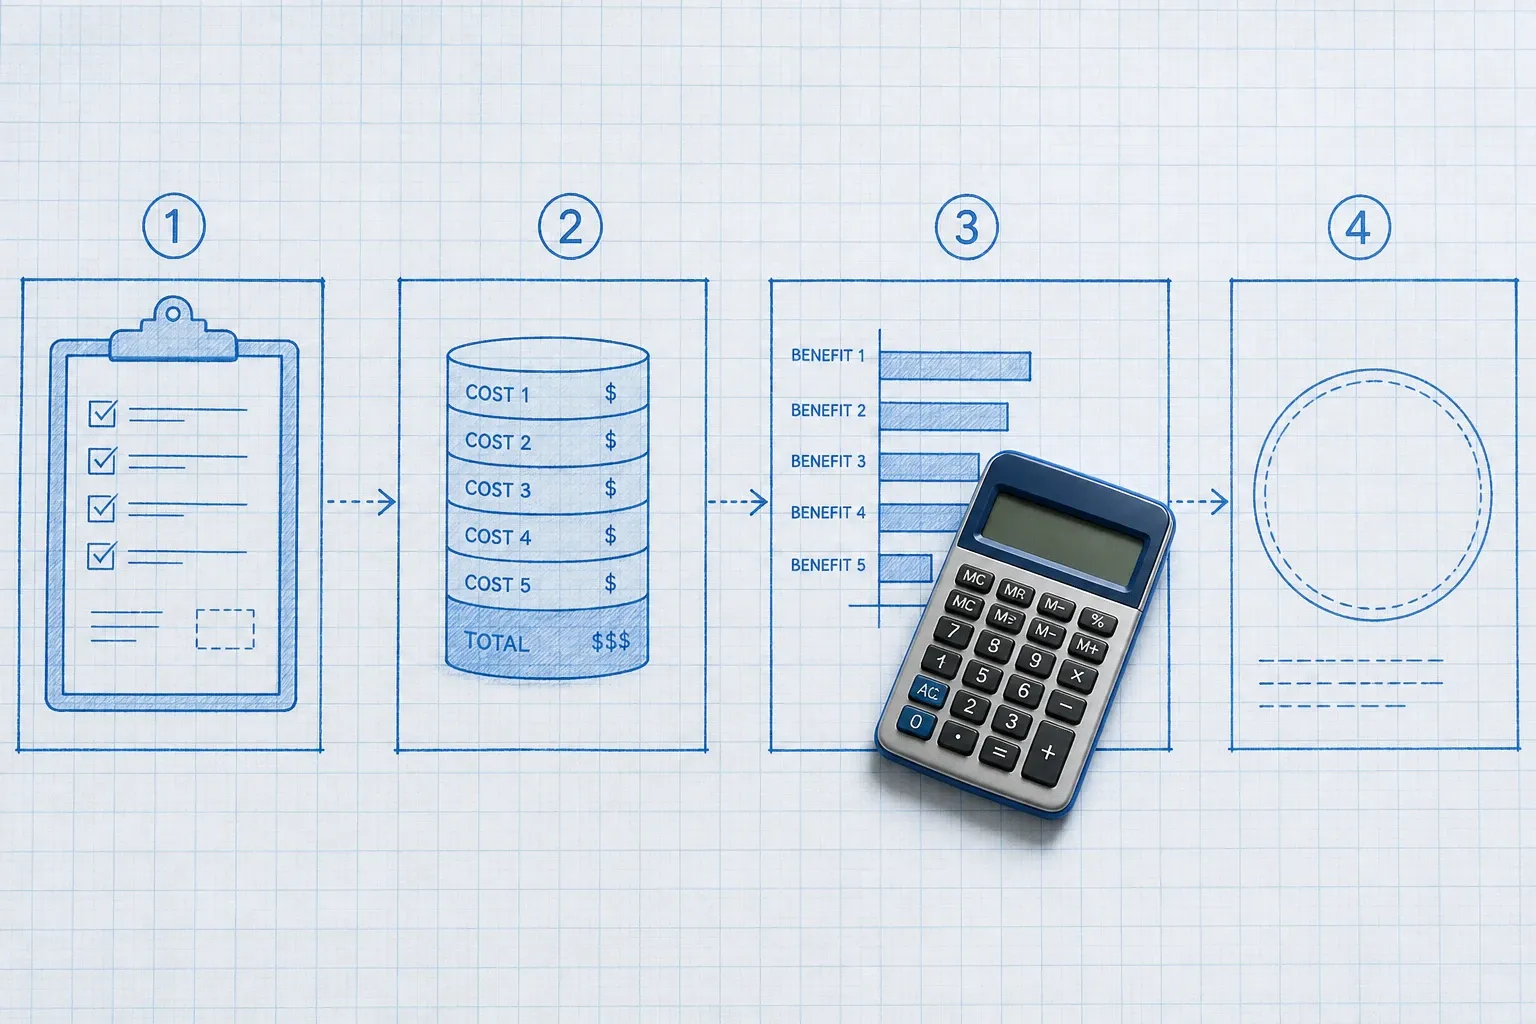
How do you build a WMS ROI calculator step by step?
Step 1: Capture a 90-day baseline
Pull last quarter's:
- Orders shipped and lines picked
- Warehouse labor hours and overtime
- Inventory accuracy (cycle count or wall-to-wall variance)
- Mis-shipment / return rate tied to warehouse error
- Average inventory value and turns
Without a baseline, post-go-live ROI is storytelling.
Step 2: List every cost with a named owner
Create a cost table with vendor quote, internal IT hours, and floor hardware. Assign an owner to each line. Ambiguous lines get cut or challenged.
Step 3: Model benefits in ranges (low / expected / high)
Never take a vendor's top-end productivity claim as your "expected" case. Build three scenarios:
- Low: 8% to 10% labor gain, modest accuracy lift
- Expected: 12% to 18% labor gain, inventory accuracy improvement in the teens
- High: only if your current process is highly manual and error-prone
Present expected and low. Keep high in the appendix.
Step 4: Run ROI and payback on the expected case
Finance cares about cash timing. Show monthly net benefit for year one, including the fact that benefits ramp after training. A flat "full benefits from day one" chart is a red flag.
Step 5: Separate hard savings from strategic upside
Hard savings: labor, inventory carrying cost, error rework, avoided temp labor.
Strategic upside: conversion from faster delivery promises, customer retention, faster site onboarding, ability to add channels without hiring proportionally.
According to Gartner’s 2024 Magic Quadrant research, 80% of companies with WMS software achieve a return on their investment within 24 months. That benchmark is useful context. It is not a substitute for your model.
How do you make the internal business case stick?
A correct calculator still fails if the story is wrong. Ops leaders who win approval treat the deck like a finance memo, not a feature tour.
Lead with the problem in dollars
Open with what broken inventory and slow picks already cost you each quarter. Then show the investment. Then show payback. Features come last.
Tie every benefit line to a KPI you already report
Examples:
- Labor hours per 100 orders
- Inventory record accuracy
- Order accuracy / mis-ship rate
- Orders shipped before cutoff
- Overtime hours in peak months
If you do not currently track a metric, do not claim a precise dollar savings from it. Commit to measuring it after go-live instead.
Name the risks of doing nothing
Peak season overtime, chargebacks, stockouts on hero SKUs, and delayed channel expansion are all "cost of staying." "The spreadsheet still works" is not a financial position when volume is growing.
Show the implementation path, not just the software
Decision makers reject projects that look operationally risky even when ROI is strong. A clear timeline, cutover plan, and success criteria reduce that fear. Point to a staged rollout rather than a big-bang fantasy.
Ask for a decision package, not unlimited debate
Recommend: approve expected-case investment, require a 90-day post-go-live ROI review, and lock KPI owners. That feels disciplined. Open-ended "let's keep researching tools" usually means no.
What does a credible one-page ROI summary look like?
Use a single page for the executive packet:
Line | Example |
|---|---|
Current annual warehouse pain (labor OT + errors + excess stock) | $140,000 |
Proposed year-one investment | $80,000 |
Expected annual net benefit (year 2 run-rate) | $71,000 |
Payback | 13 to 15 months |
Year-one KPI targets | Accuracy 97%+, mis-ships −50%, OT −20% |
Review date | 90 days after go-live |
Attach the detailed calculator as an appendix. Decision makers skim the one-pager. Analysts dig into the model.
Common ROI mistakes that kill the case
Using vendor averages as your baseline. Your wage rates, SKU mix, and error costs are not "industry average."
Counting only labor. Inventory and error costs often outweigh pick-rate gains, especially in ecommerce.
Ignoring change management. If adoption is weak, benefits slip and payback stretches. Budget training like a first-class cost.
Promising revenue uplift without a mechanism. "Better CX" is fine as a secondary point. Do not put unattributed revenue into the primary ROI unless you can explain the causal path (faster cutoff, fewer stockouts on top sellers, fewer cancellations).
Forgetting run cost. A strong year-one ROI that ignores year-two subscription looks clever until renewal.
Putting it together
Calculating WMS ROI is less about finding a magic percentage and more about building a transparent model your leadership can audit. Capture a real baseline, price the full investment, quantify labor and inventory and error savings in ranges, then present payback beside ROI.
If you are still early in vendor evaluation, pair this calculator with a structured mid-market buying guide so the tool you pick can actually deliver the benefits you modeled. The best ROI case is honest about cost, conservative about upside, and clear about how you will measure results after go-live.
Frequently asked questions
What is a good ROI for a warehouse management system?
A solid WMS ROI for mid-market brands is typically 50% or higher in year one when you include labor, inventory carrying cost, and error-reduction savings. Many teams also target a payback period of 12 to 24 months. What matters more than a round percentage is that your model uses your own volumes, wage rates, and error costs.
How long does it take to get ROI from a WMS?
According to Gartner’s 2024 Magic Quadrant research, 80% of companies with WMS software achieve a return within 24 months. Early gains often show up in three to six months through fewer mispicks and better inventory accuracy. Full payback depends on scope, data quality at go-live, and how completely you measure benefits.
What costs should I include in a WMS ROI calculator?
Include software subscription or license fees, implementation and integration services, handheld scanners or mobile devices, training and change management, and ongoing support. Skipping hardware or integration work is the fastest way to understate cost and lose credibility with finance.
How do I calculate labor savings from a WMS?
Multiply warehouse headcount by fully loaded hourly cost, annual hours, and a conservative productivity gain (often 10% to 20% for mid-market sites). Or estimate minutes saved per order times annual order volume times labor cost per minute. Use your current pick rates and overtime as the baseline so the number is defensible.
Should I show soft benefits in a WMS business case?
Yes, but separate them from hard-dollar savings. Put labor, inventory, and error costs in the primary ROI model. Put customer retention, faster onboarding, and peak agility in a secondary slide with metrics finance can track later. Soft benefits support the story. Hard numbers get the signature.
Plan the route. We deliver the rest.
See how Binlogic powers last-mile logistics — routing, tracking, and the platform that turns the plan into the package on the doorstep.
Book a callback