
















ABC Inventory Classification: How to Prioritize What You Count
ABC inventory classification groups SKUs into A, B, and C tiers by annual usage value so you count the items that can hurt you most, most often. Use it to set cycle count frequency, tighten controls on A items, and stop treating every SKU like it deserves the same attention.
ABC inventory classification is how you decide which SKUs earn frequent cycle counts and which can wait. You rank items by annual usage value, split them into A, B, and C tiers, then set count frequency and control rules to match the risk of being wrong.
ABC inventory classification is the practice of grouping warehouse SKUs into three priority classes based on value contribution so labor, accuracy targets, and cycle count schedules follow financial and operational impact instead of treating every item the same.
If you count everything on the same cadence, you burn hours on low-risk C items while an A-item variance quietly wrecks fill rate. Classification fixes that imbalance.
Why does ABC inventory classification matter for cycle counting?
Most warehouses do not fail because they refuse to count. They fail because they count the wrong things at the wrong pace.
CAPS Research data discussed by the Institute for Supply Management puts average inventory accuracy around 91%, with the weakest performers near 67%. That gap is rarely closed by "count more." It is closed by counting the SKUs whose errors cost the most, then fixing the process that created the miss.
Inventory also ties up cash. Industry guidance summarized by Modern Materials Handling puts inventory carrying cost in the 20% to 30% of inventory value range each year. When a high-value A item is wrong, you feel it in expedites, write-offs, and service failures. When a C item is wrong by a few units, the financial hit is usually smaller. ABC inventory classification puts your limited count hours where the carrying-cost and service risk is concentrated.
The 2025 MHI Annual Industry Report (with Deloitte) found that 92% of surveyed leaders rate inventory and network optimization as an important technology investment. Classification is one of the simplest ways to make that investment pay off on the floor: same headcount, better accuracy where it matters.
How do you calculate ABC classes?
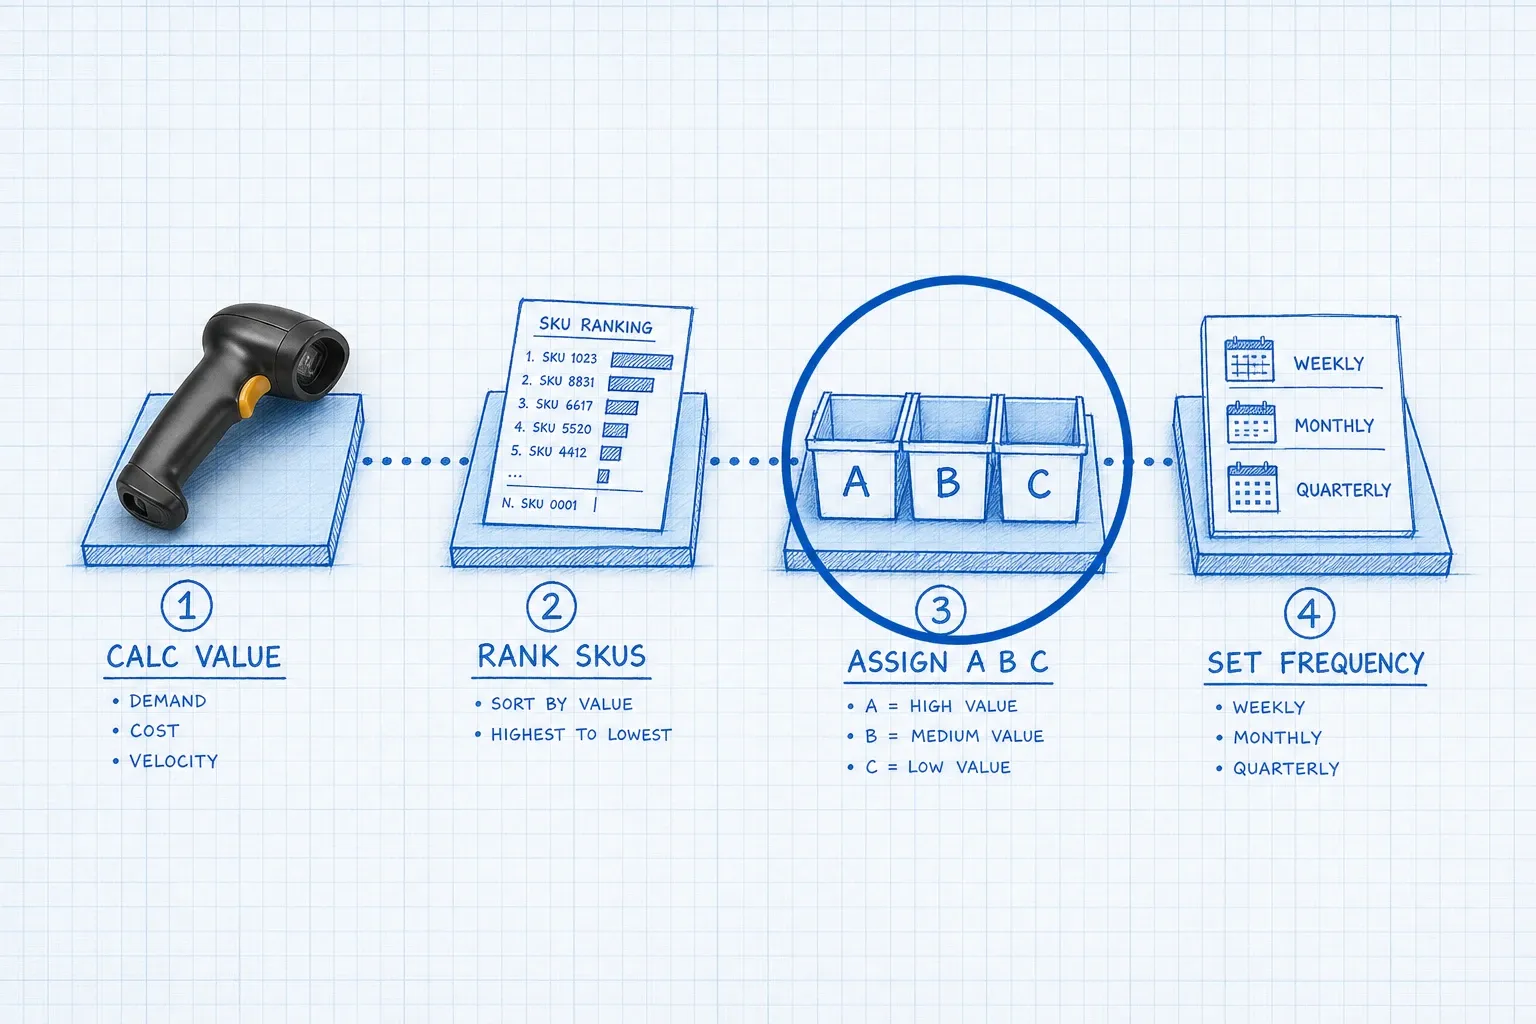
Start with a clean 12-month window of movement for every active SKU. Annual usage value is the usual ranking metric:
Annual usage value = units issued or sold in the period × unit cost
Then:
- Sort SKUs from highest annual usage value to lowest.
- Add a cumulative percentage of total value.
- Mark the SKUs that make up roughly the first 70% to 80% of value as A.
- Mark the next 15% to 25% as B.
- Mark the remaining long tail as C.
- Review exceptions before you lock the list.
A typical shape looks like this:
Class | Share of SKUs | Share of value | Control posture |
|---|---|---|---|
A | About 10% to 20% | About 70% to 80% | Tightest counts and tolerances |
B | About 20% to 30% | About 15% to 25% | Steady scheduled control |
C | About 50% to 70% | About 5% to 10% | Simple coverage, lower frequency |
Those percentages are starting points, not laws. A jewelry brand and a fasteners distributor will both land near Pareto, but their cut lines will differ. What matters is that your A list is short enough to count often and valuable enough that leadership cares when it drifts.
What should you do with exceptions?
Pure dollar ranking misses operational reality. Promote or demote SKUs when:
- A low-cost component stops a kit or production line
- Lead time is long and a stockout is hard to recover
- Shrinkage or variance repeats for the same SKU
- A seasonal hero item spikes for 8 to 12 weeks
- Regulatory or lot-tracked product needs tighter proof of accuracy
Write the exception rule down. Otherwise every manager invents a private A list and your schedule falls apart.
How often should you count each ABC class?
Classification without a calendar is just a report. Tie each class to a starting frequency, then adjust with your own variance history.
Class | Starting count frequency | Why it works |
|---|---|---|
A | Every 30 days (weekly for critical or high-variance SKUs) | Small errors become expensive or customer-facing fast |
B | Every 60 to 90 days | Enough control without drowning the team |
C | Every 180 to 365 days | Coverage without burning labor on the long tail |
Problem SKUs | Weekly until stable | Repeated misses need process attention, not hope |
If you already run cycle counting, ABC is the prioritization layer that makes the program finishable. If you are still deciding how often to count warehouse inventory, start with the table above and recalculate daily count volume:
(A SKUs × counts per year) + (B SKUs × counts per year) + (C SKUs × counts per year) ÷ working days = daily count target
Example: 800 A SKUs × 12, 1,500 B SKUs × 4, and 4,000 C SKUs × 1 = 9,600 + 6,000 + 4,000 = 19,600 count events per year. Across 250 working days, that is about 78 counts per day. That number tells you whether you need one dedicated counter, a shared morning window, or a tighter A list.
What accuracy targets fit each class?
Match tolerance to risk:
- A items: aim for 98%+ location accuracy and investigate small dollar variances
- B items: 96% to 98% with standard recount thresholds
- C items: 94% to 96%, with wider unit tolerances where unit cost is tiny
Do not celebrate a 99% warehouse score if the misses are concentrated in A items. Overall inventory accuracy is useful. Class-level accuracy is actionable.
How do you turn ABC classes into floor rules?
Counting is only one control. Once classes exist, use them in daily warehouse rules:
Slotting and location control
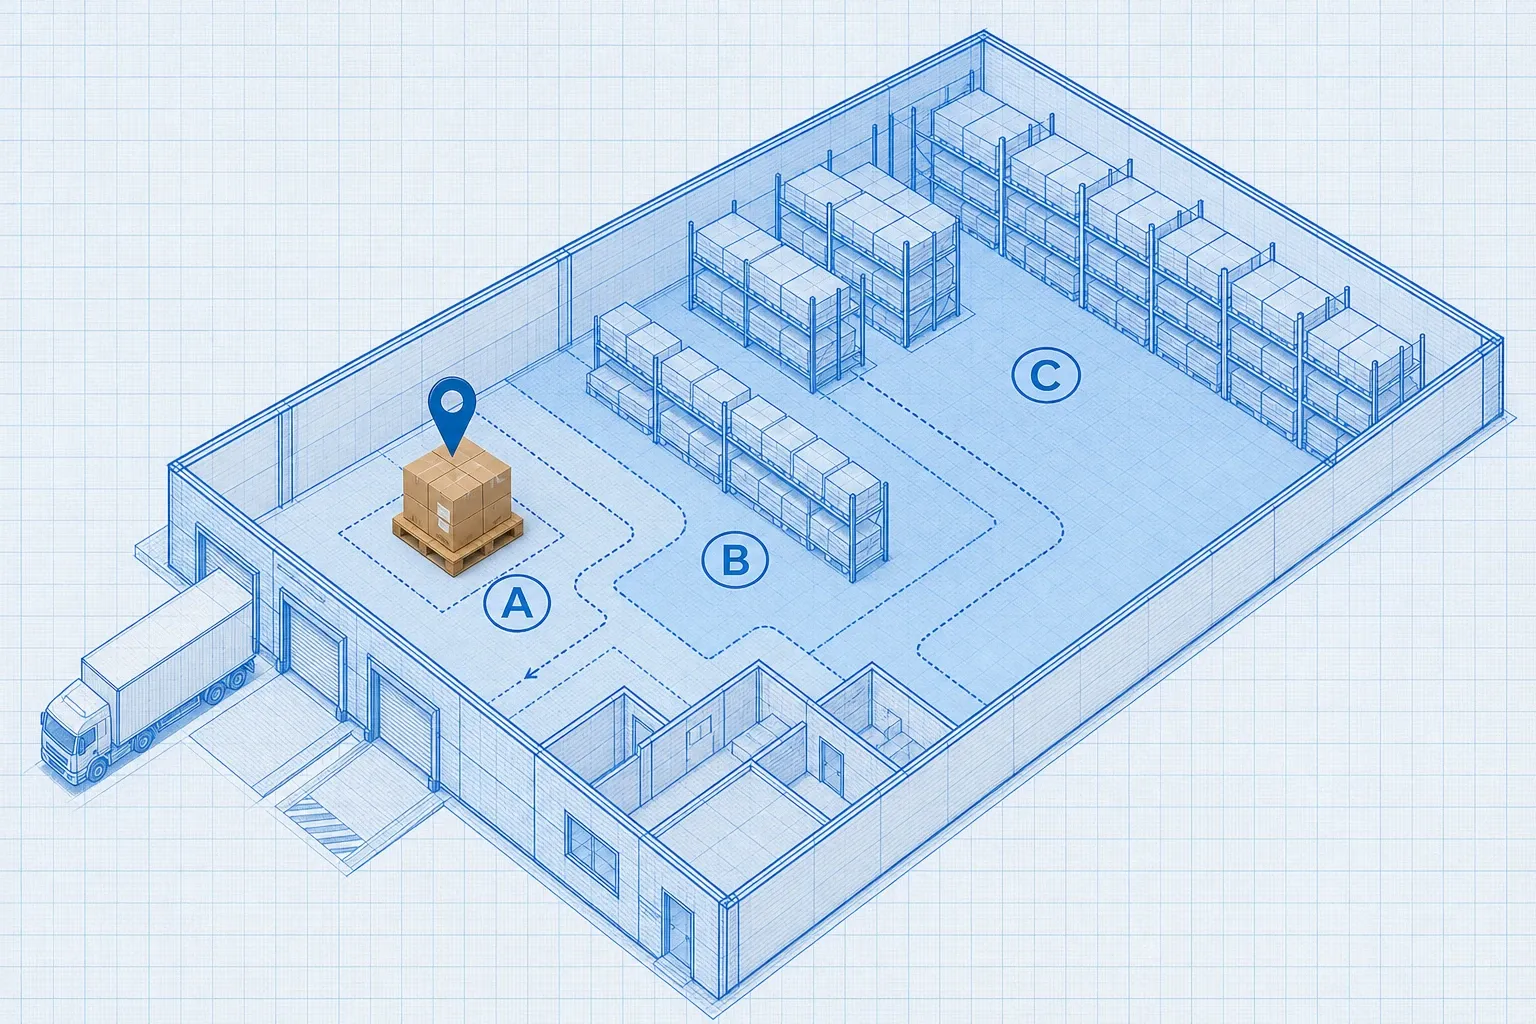
Put A items in locations that are easy to count and hard to mispick: waist height, clear labels, limited dual locations. Keep C bulk in denser storage where a less frequent count is still practical.
Receiving and putaway
A items get stricter PO matching and faster dock-to-stock. If your receiving process is sloppy, A-item cycle counts will keep finding the same inbound errors.
Picking confirmation
Require scan confirmation on A picks. Allow simpler confirmation on low-risk C picks only after your A and B accuracy is stable.
Reorder and safety stock
A items deserve tighter forecasts and reviewed safety stock. C items can often use simpler min/max rules. Classification keeps planners from over-engineering the long tail.
Shrinkage and root-cause review
Review A variances weekly. Review B monthly. Roll C issues into a quarterly theme review unless a hotspot appears. The goal is not more meetings. The goal is faster fixes where dollars move.
What mistakes break ABC inventory classification?
Treating the ranking as permanent
Demand shifts. Costs change. New SKUs launch. Rebuild the classification at least twice a year, and after any major catalog or channel change.
Ranking on unit cost alone
A $200 item that sells twice a year is not automatically more important than a $8 item that ships 40,000 times. Usage value beats unit cost.
Making the A list too big
If half your catalog is "A," you do not have a priority system. You have a motivational poster. Keep A small enough that the team can actually finish the cadence.
Ignoring C items completely
C items still need a schedule. Skip them for two years and you get phantom locations, dead stock surprises, and ugly annual physicals. Low frequency is not zero frequency.
Never closing the loop
A count that only adjusts the book without finding the cause trains the warehouse to accept drift. Every material A variance should leave with a reason code: mispick, putaway error, unscanned return, supplier short, theft, or system lag.
For the conceptual primer behind the method, see what ABC analysis is in inventory management. Use that piece when someone asks "what is it?" Use this one when they ask "how do we prioritize what we count?"
How do you roll out ABC classification in 30 days?
Week 1: Export and rank
Pull 12 months of issues/sales and unit cost. Calculate usage value. Produce the first A/B/C cut. Have ops and finance review the top 50 A SKUs together.
Week 2: Set frequencies and daily volume
Apply the starting cadence. Calculate the daily count target. Confirm you have people, scanners, and a quiet window that does not collide with outbound peak.
Week 3: Pilot on A items only
Run A counts for two weeks. Measure completion rate, recount rate, and top variance causes. Do not expand to B and C until A counts finish on schedule.
Week 4: Expand and publish the rules
Add B and C to the calendar. Publish slotting, scan, and recount rules by class. Put the next reclassification date on the calendar now so it does not get forgotten.
A WMS makes this durable. Spreadsheets can produce the first ranking, but they go stale the week demand shifts. Tools like BinLogic WMS can recalculate classes from live transactions and push cycle count tasks by tier, so the priority list stays tied to what is actually moving.
What results should you expect?
Give the program a full quarter before judging it. Early wins usually show up as:
- Fewer emergency A-item stockouts
- Shorter recount queues because the daily list is sized correctly
- Cleaner physical inventory or a smaller year-end surprise
- Better conversations with finance because adjustments concentrate on known problem SKUs
You will not jump from mid-80s accuracy to world-class in a month. You will stop wasting count labor on SKUs that barely move the P&L, and you will catch the misses that do.
Soft next step
If your team still counts "whatever is on this week's clipboard," ABC inventory classification is the shortest path to a schedule people can finish. Rank by annual usage value, keep the A list short, count it often, and review exceptions on a fixed cadence. When you are ready to stop rebuilding that ranking in a spreadsheet every month, look at a WMS that can classify SKUs and generate counts from the same system that runs receiving and picking.
Frequently asked questions
What is ABC inventory classification?
ABC inventory classification ranks every SKU by annual usage value (units sold or used times unit cost), then splits the list into three tiers. A items are the small share of SKUs that drive most of the value. B items sit in the middle. C items are the long tail of low-value SKUs. The point is to match control and count effort to financial risk.
How often should you cycle count A, B, and C items?
A practical starting schedule is A items every 30 days, B items every 60 to 90 days, and C items every 180 to 365 days. Raise frequency for any SKU with repeated variance, long lead times, or high stockout cost. Review the schedule after the first full count cycle and adjust with your own discrepancy data.
Is ABC classification only based on dollar value?
Dollar usage value is the default starting metric because it maps cleanly to financial risk. Many warehouses then overlay velocity, criticality, lead time, and shrinkage history. A low-cost part that stops a production line can deserve A-level attention even if its dollar value is modest.
How is ABC inventory classification different from ABC analysis?
They are the same core method. "ABC analysis" usually describes the ranking itself. "ABC inventory classification" emphasizes how you use those tiers to set operating rules such as count frequency, reorder policy, and location controls. If you want the definitional primer, see our guide on what ABC analysis is. This post focuses on turning the classes into a count plan.
Can a WMS automate ABC inventory classification?
Yes. A modern WMS can calculate usage value from transaction history, assign classes, and generate cycle count tasks by tier. Tools like BinLogic WMS keep the ranking tied to live movement data so your count list stays current without a monthly spreadsheet rebuild.
Plan the route. We deliver the rest.
See how Binlogic powers last-mile logistics — routing, tracking, and the platform that turns the plan into the package on the doorstep.
Book a callback